ChatGPT · Field Edition
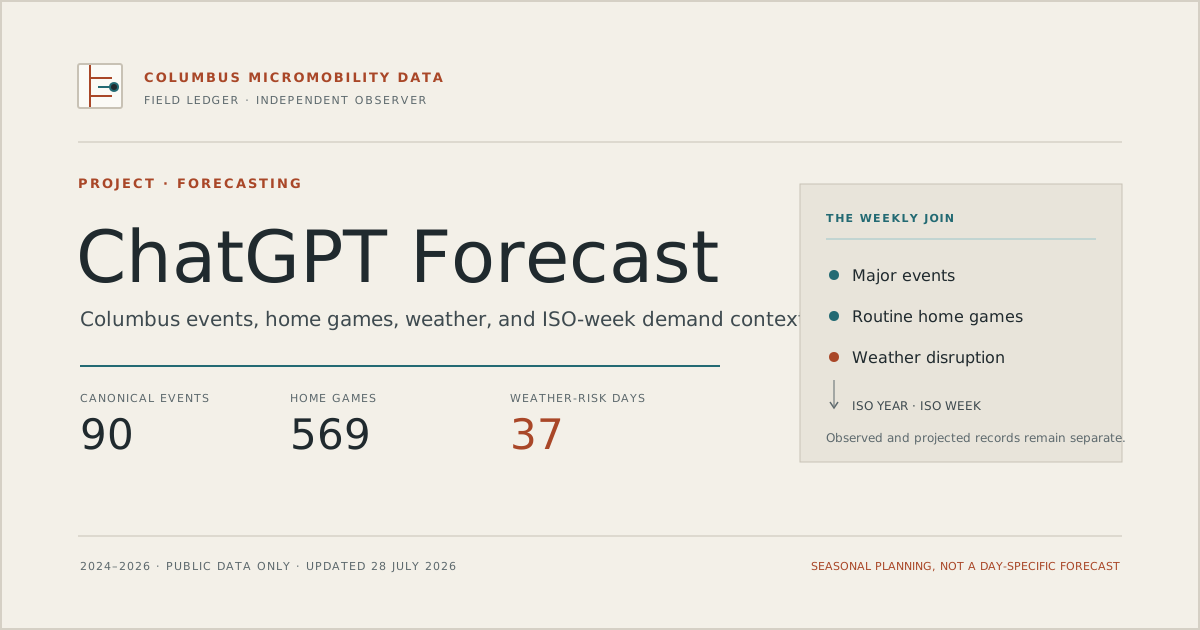
ChatGPT Forecast
Branded operating guide with event and holiday separation, ISO-week correlation, historical weather patterns, projected weather-risk caveats, and source methodology for demand forecasting.
Forecast guides, source inventories, project cards, and comparable analysis charts. Each artifact remains labeled by source so its provenance is visible.
Working artifacts document the event, holiday, ISO-week, and weather context used for demand planning. ChatGPT and Claude reference sets are retained separately so their methodological provenance remains visible for comparison.
Branded operating guide with event and holiday separation, ISO-week correlation, historical weather patterns, projected weather-risk caveats, and source methodology for demand forecasting.
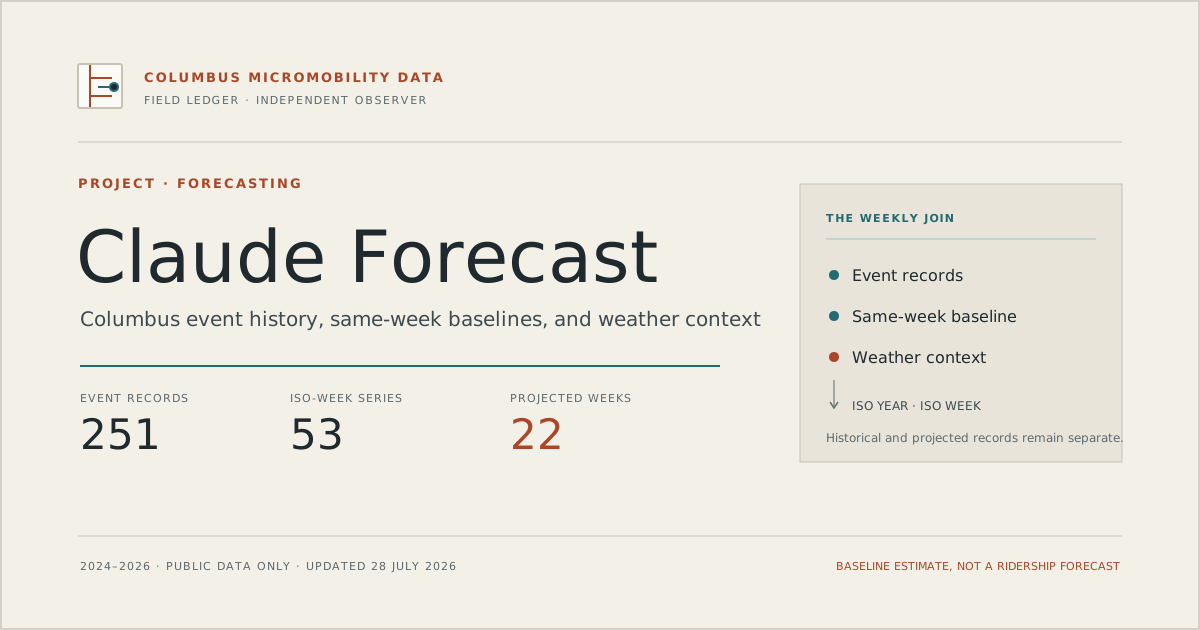
Companion source guide and historical event workbook retained as supplied for methodological comparison and reference. Includes event records, ISO-week series, projected weeks, and joining logic.
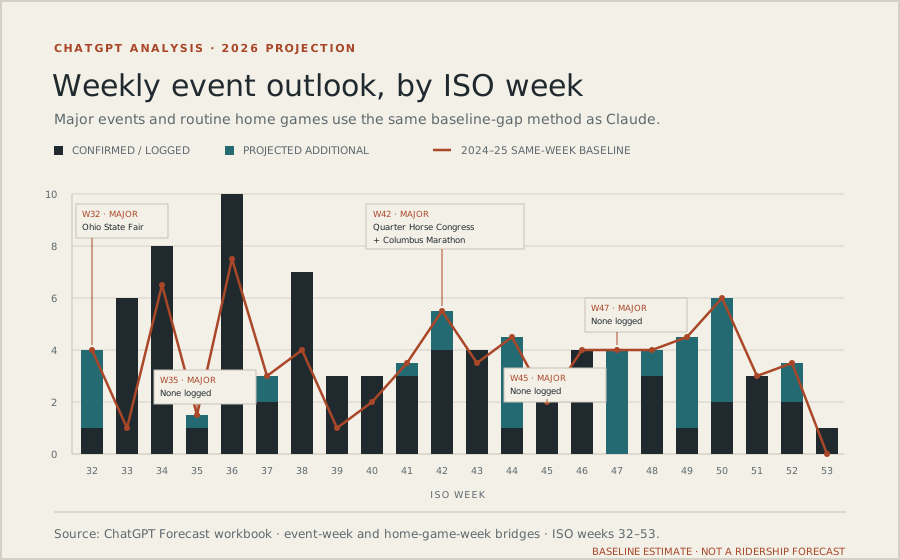
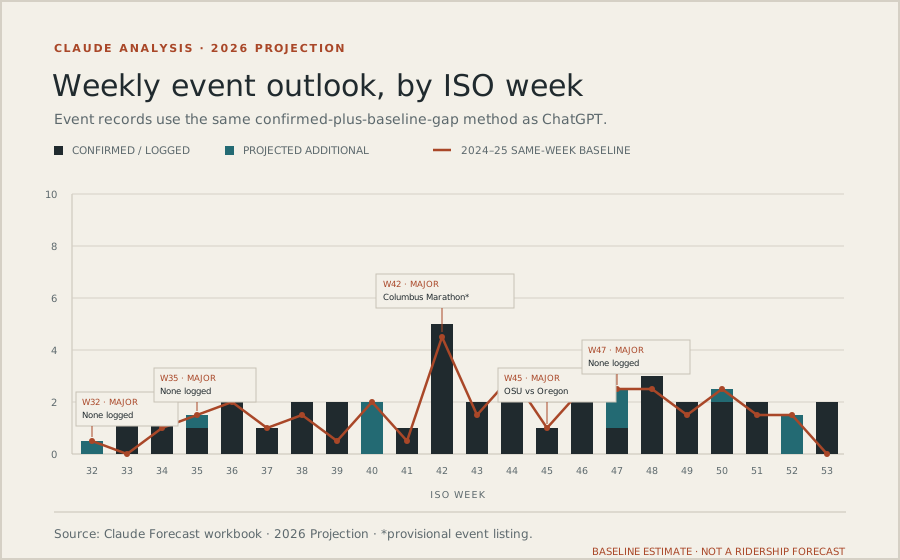
135 events from ChatGPT Forecast (90) and Claude Forecast (45) models (2024–2026). Search, filter by date range or source, and view ISO week assignments.
| ID | Event Name | Category | Area | Impact | Src | ISO YR-WK | Dates |
|---|
Loading... events · All sources
These guides and charts represent two independent forecasting approaches applied to the same Columbus GBFS fleet data. Both use historical event catalogs, ISO-week correlations, and weather signals to project demand. The side-by-side comparison enables validation and cross-methodological review.
Data lineage: All forecasts derive from public GBFS feeds (Spin and Veo), publicly available holiday/event calendars, and historical weather records. No proprietary data. Full methodologies documented in the Word guides.